Return on Equity: A CFO's Guide to Profitability
Today’s volatile business environment requires CFOs to optimize performance, ensure financial resilience and enable sustainable growth. To do this, they need clear, actionable metrics, and return on equity (ROE) is one of the most strategic for improving shareholder value. (Internationally, ROE is also referred to as return on total equity or equity return rate).
ROE isn’t just an accounting figure. It’s an indicator that reflects the company's ability to transform equity capital into real value and is therefore a key tool for evaluating the efficiency of your financial strategy as a whole.
For a modern CFO, monitoring ROE means:
- Understanding whether the capital structure is sustainable and efficient
- Evaluating the impact of operational and financial choices on value creation
- Improving comparability with competitors, including in terms of M&A or ESG positioning
In this article, we analyze what ROE really means, how to calculate it, what pitfalls it hides and — above all — how it can be improved through reliable data, integrated visibility and intelligent automation.
ROE definition, formula & comparison with other indicators
Understanding the ROE ratio is the first step to strategically interpreting corporate profitability. This indicator measures the return on any equity invested in the company, representing a crucial point of reference for CFOs in evaluating financial performance.
ROE formula, explained
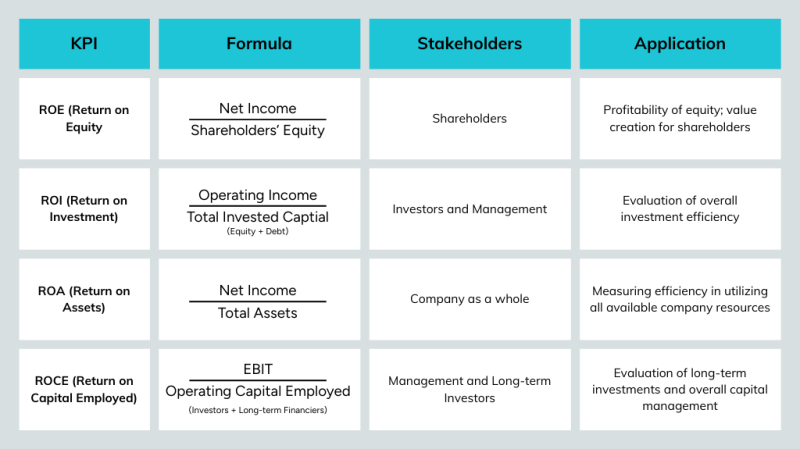
ROE = net profit / shareholders' equity
With this equation, you can analyze the efficiency of the capital contributed by shareholders. To correctly frame ROE in the broader ecosystem of financial ratios, it’s useful to compare it with other relevant KPIs.
In their role as “profitability director,” CFOs cannot limit themselves to calculating ROE once. They must interpret its dynamics over time, compare it between divisions or business units, and understand its determinants. The ROE index thus becomes a strategic compass for evaluating sustainability, efficiency and shareholder returns, integrating with other financial metrics in a cohesive decision-making framework.
Why ROE is an essential KPI for the Office of the CFO
In the increasingly strategic role of the modern CFO, ROE is becoming one of the key indicators for evaluating the overall effectiveness of financial management. It’s not just a number to be displayed in quarterly reports, but a true compass for guiding critical decisions on capital allocation, capital structure and sustainable growth strategies.
A high ROE, if supported by healthy growth and an appropriate amount of financial leverage, signals a company capable of generating value efficiently. This is crucial to attract investors, obtain better credit terms and foster confidence in management.
Conversely, a low or declining ROE can be a warning for stakeholders, indicating possible operational inefficiencies or an unbalanced capital structure.
For the CFO, monitoring and improving ROE means:
- Evaluating the return on equity in relation to business objectives
- Identifying areas where costs, pricing or financial structure can be optimized
- Supporting strategic planning with objective and comparable data
- Improving how you compare to other industry players, especially to companies with similar capital structures
Ultimately, ROE is more than a financial metric. It’s a strategic indicator of how well the Finance function is turning vision into value. It helps CFOs ask the right questions:
- Are we allocating capital efficiently?
- Are we creating sustainable returns?
- Are we positioning the company for long-term growth?
ROE & DuPont analysis: understanding operating & financial leverage
For CFOs who want to look beyond the surface of the numbers, the DuPont ROE breakdown is a helpful tool for understanding how and why return on equity is generated. In other words, ROE is not just the bottom line, but the sum of multiple economic and financial forces that can (and should) be managed.
How to calculate ROE with the DuPont formula
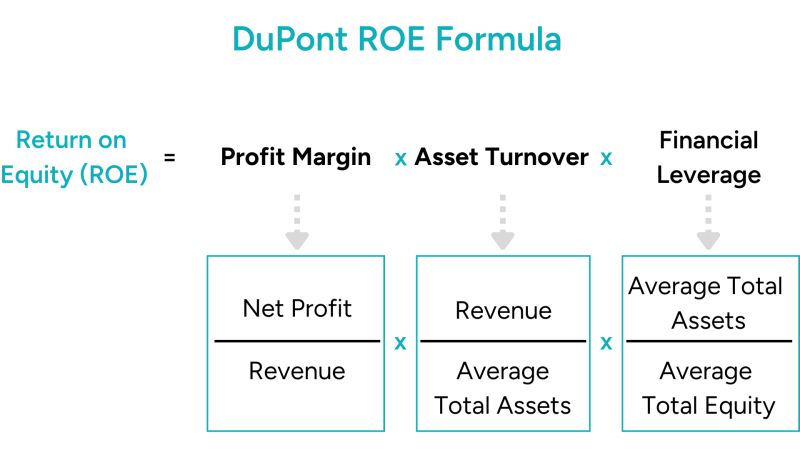
ROE = profit margin × asset turnover × leverage
The DuPont formula breaks down ROE into three main components:
- Profit margin: measures operating profitability (net profit / revenue)
- Asset turnover: how efficiently assets are used to generate sales (revenue / total assets)
- Leverage: impact of the ratio of total assets to equity (total assets / equity)
ROE analysis allows the CFO to precisely identify which levers to pull to improve return on capital:
- If the problem is margin, act on operational efficiency or the pricing strategy
- If turnover is low, asset management and working capital need to be improved
- If leverage is excessive, financial sustainability risks and ROE volatility need to be assessed
In a context where CFOs must balance performance and resilience, the DuPont analysis is a practical guide to tie financial statement analysis to operational reality, offering clear and actionable insights.
ROE and digitalization: why automation is a strategic lever for profitability
When decision-making speed and quality of financial information are priorities, ROE can become an even more powerful KPI if integrated into an advanced digital system. CFOs who operate with reliable, real-time and consistently aggregated data are able to analyze, interpret and improve ROE proactively.
This is where the value of intelligent platforms like Esker comes in. By automating core processes like Accounts Payable (or the broader Source-to-Pay cycle), Accounts Receivable and Customer Service, companies:
- Eliminate bottlenecks that slow down the economic cycle
- Reduce net working capital, improving operating efficiency
- Gain integrated visibility into cash flows, margins and assets employed
- Enable data governance that allows you to calculate ROE and other KPIs with precision and promptness
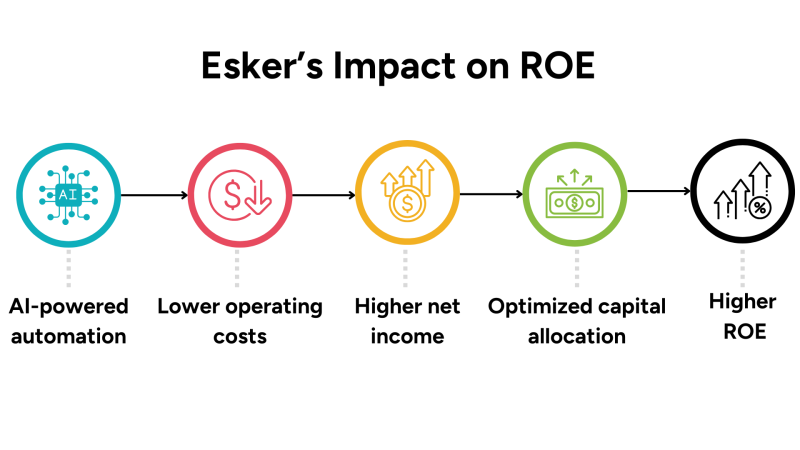
Esker's accounting and financial automation suite, powered by Synergy AI, allows you to analyze the impact of payment policies, collection terms and supplier management on your return on equity. In this way, ROE analysis is no longer a retrospective exercise, but a simulation, forecasting and guidance tool.
Betsy Francoeur
As a Copywriter at Esker, Betsy loves writing about the source-to-pay and order-to-cash cycles and creating valuable content for financial professionals. She also enjoys running 5ks, kayaking, traveling with her husband and snuggling her dog.